DORA metrics: the 4 measurements that actually gauge team performance
Velocity, story points, tickets closed: these numbers say nothing about team health. DORA metrics, on the other hand, are correlated with real business outcomes. Here is why they change the conversation.
Your team delivers 40 story points per sprint. The backlog moves. Tickets get closed. And yet users have been waiting on features for six months, production incidents are multiplying, and every deployment triggers collective anxiety. Something is wrong.
The problem is not the team. The problem is what you measure.
Velocity, story points, tickets closed: these metrics measure activity. Not value delivery. Not system reliability. Not the team’s actual capacity to move a product forward.
DORA metrics exist precisely to fix this problem.
Where do DORA metrics come from?
DORA stands for DevOps Research and Assessment. It is a research program launched by Google that analyzed, over several years, the practices of thousands of development teams across companies of all sizes.
The goal was simple: find which practices and metrics actually correlate with organizational performance. Not what people think works. What actually works, measured on real data.
The result: 4 metrics that proved to be reliable predictors of business performance - profitability, market share, customer satisfaction, and ability to meet organizational goals.
These 4 metrics do not measure whether the team is busy. They measure whether the team delivers.
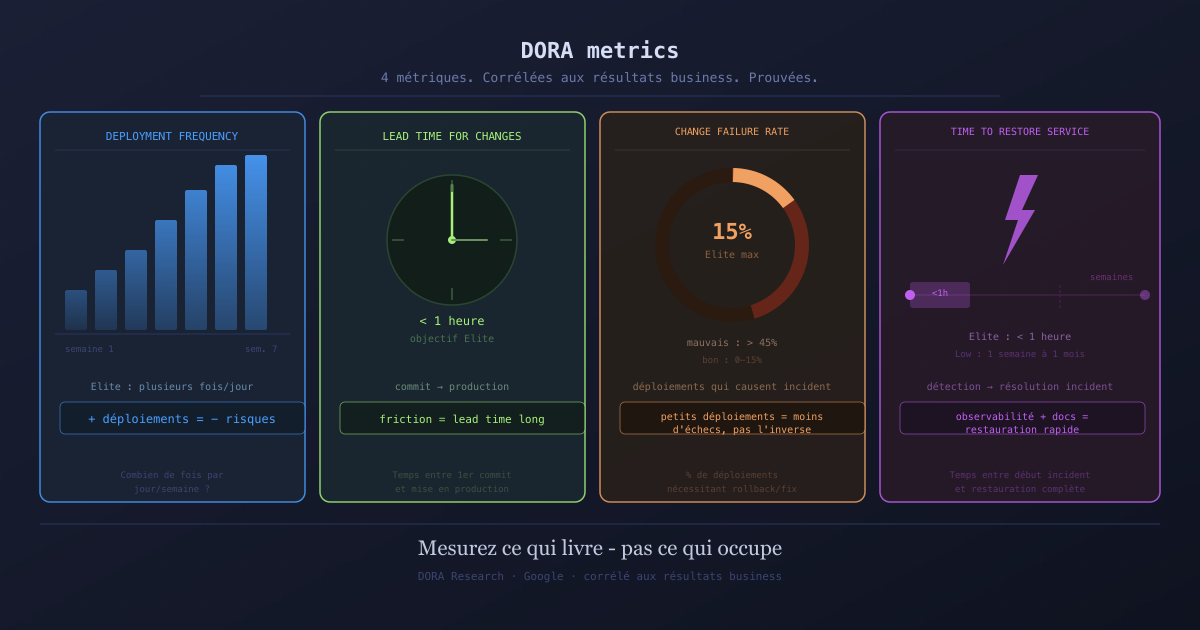
The 4 DORA metrics
1. Deployment Frequency: how often do you deploy?
Deployment frequency measures how many times a team puts code into production over a given period.
Elite teams deploy multiple times per day. Low-performing teams deploy once a month or less.
This is not a matter of company size or industry sector. It is a matter of practices: trunk-based development, feature flags, mature CI/CD pipelines. When these practices are in place, deploying becomes a routine act. When they are absent, each deployment is a risky event that gets postponed.
The irony: the more deployments are delayed, the riskier they become, which pushes teams to delay them even further.
2. Lead Time for Changes: how long from commit to production?
Lead time for changes measures the delay between when a developer writes code and when that code is in production and usable by end users.
This delay includes: code review, automated tests, approval processes, and the deployment itself.
Elite teams have a lead time under one hour. Low-performing teams have lead times of several weeks or months.
A long lead time is not a development speed problem. It is an organizational friction problem: overly heavy approval processes, long branches that diverge, test suites that take hours to run, unstable staging environments.
3. Change Failure Rate: what percentage of deployments cause an incident?
The change failure rate measures what proportion of production deployments require an urgent fix, a rollback, or cause a service degradation.
Elite teams have a rate between 0% and 15%. Low-performing teams can exceed 45%.
Counter-intuitively, teams that deploy most often generally have a better change failure rate. Small, frequent deployments are easier to test, validate, and roll back if needed. Large, infrequent deployments are riskier - not safer.
4. Time to Restore Service: how long to recover from an incident?
Time to restore measures how long elapses between the start of a production incident and its resolution.
Elite teams restore service in under an hour. Low-performing teams take between one week and one month.
This metric reflects the maturity of observability practices (monitoring, alerting, tracing), the quality of system documentation, and the team’s ability to diagnose and fix problems quickly under pressure.
Why these 4 metrics and not others?
The correlation with business performance was established statistically over several years of studies. This is not theory. It is an empirical result.
Teams that perform well on these 4 metrics tend to:
- Deliver features faster
- Have fewer incidents
- Pay down technical debt more easily
- Have less stressed teams
Other commonly used metrics - velocity, story points, commit count, test coverage - have not shown clear correlation with these outcomes. They can be useful locally, for diagnosing a specific problem. They are not indicators of organizational health.
The problem with vanity metrics
Velocity is the vanity metric par excellence. It measures how many points a team completes per sprint. The problem: points are not calibrated between teams, they drift over time within a single team, and they reward high estimation rather than actual delivery.
A team can have high velocity and deliver nothing useful to production. A team can have low velocity and deliver value every day.
Story points have limited utility for internal planning. Used as performance indicators, they create counter-productive behaviors: inflated estimation, artificial ticket splitting, optimizing the number rather than the outcome.
Tickets closed suffers from the same problem. Closing 20 tickets with no real business value is not performance.
How to measure DORA metrics concretely?
Deployment Frequency: log every production deployment with a timestamp. Calculate frequency over the last 30 days.
Lead Time for Changes: measure the time between the first commit of a branch and the merge to production. Most CI/CD tools can extract this automatically.
Change Failure Rate: tag every production incident with the deployment that caused it. Divide by the total number of deployments.
Time to Restore: log the start and end time of every incident. Calculate the average.
None of these measurements require a sophisticated tool to start. A spreadsheet is enough to begin.
The connection to work organization
DORA metrics do not improve by asking the team to “do better.” They improve by changing structures and processes.
A well-scoped work cycle in Sinra - with clear issues, defined capabilities, and a precise target release - naturally reduces lead time. When each issue has a clear scope and an associated release, code reaches production faster because it does not wait for other issues to make sense.
Well-defined releases also allow for meaningful change failure rate measurement: each release is a documented scope of change, with associated issues and tests.
Work organization is not separate from technical performance. DORA metrics make that visible.
Where to start?
Pick one metric. Just one. Measure it for 30 days without trying to improve it. Just understand where you stand.
Then look for the root causes behind poor numbers. A long lead time often comes from slow code review or branches that grow too long. A high change failure rate often comes from insufficient tests or too wide a deployment scope.
Fix one cause. Measure again. Iterate.
It is slower than implementing a new performance framework. And much more effective.
Ready to Transform Your Project Management?
Apply these insights with Sinra - the unified platform for modern teams.
Start Free Trial